Web Design
Chartmetric
toolbox
Employer
My Role
When
Live Site
https://chartmetric.com/OVERVIEW - CHARTMETRIC
Chartmetric is a comprehensive data analytics platform for artists, music labels, and industry professionals. It offers detailed insights into music trends, artist growth, and streaming analytics by integrating data from platforms like Spotify, Apple Music, YouTube, and social media. With tools for tracking chart rankings, playlist performance, and audience demographics, Chartmetric helps users make informed decisions for marketing, artist development, and fan engagement.
UX Designer
- Conducted user research to guide design decisions
- Created a cohesive style guide for consistent branding
- Built a scalable design system for easy updates
- Presented design concepts to stakeholders for feedback
Tool
Peers
Project Manager
Duration
Status
Results & Impact
The redesign significantly improved usability by making navigation more intuitive and enhancing data visualization for better insights. Users can now access key metrics faster, interpret data more easily, and complete tasks with greater efficiency. The changes have resulted in positive feedback, increased user satisfaction, and more effective decision-making for artists and industry professionals.

User Story
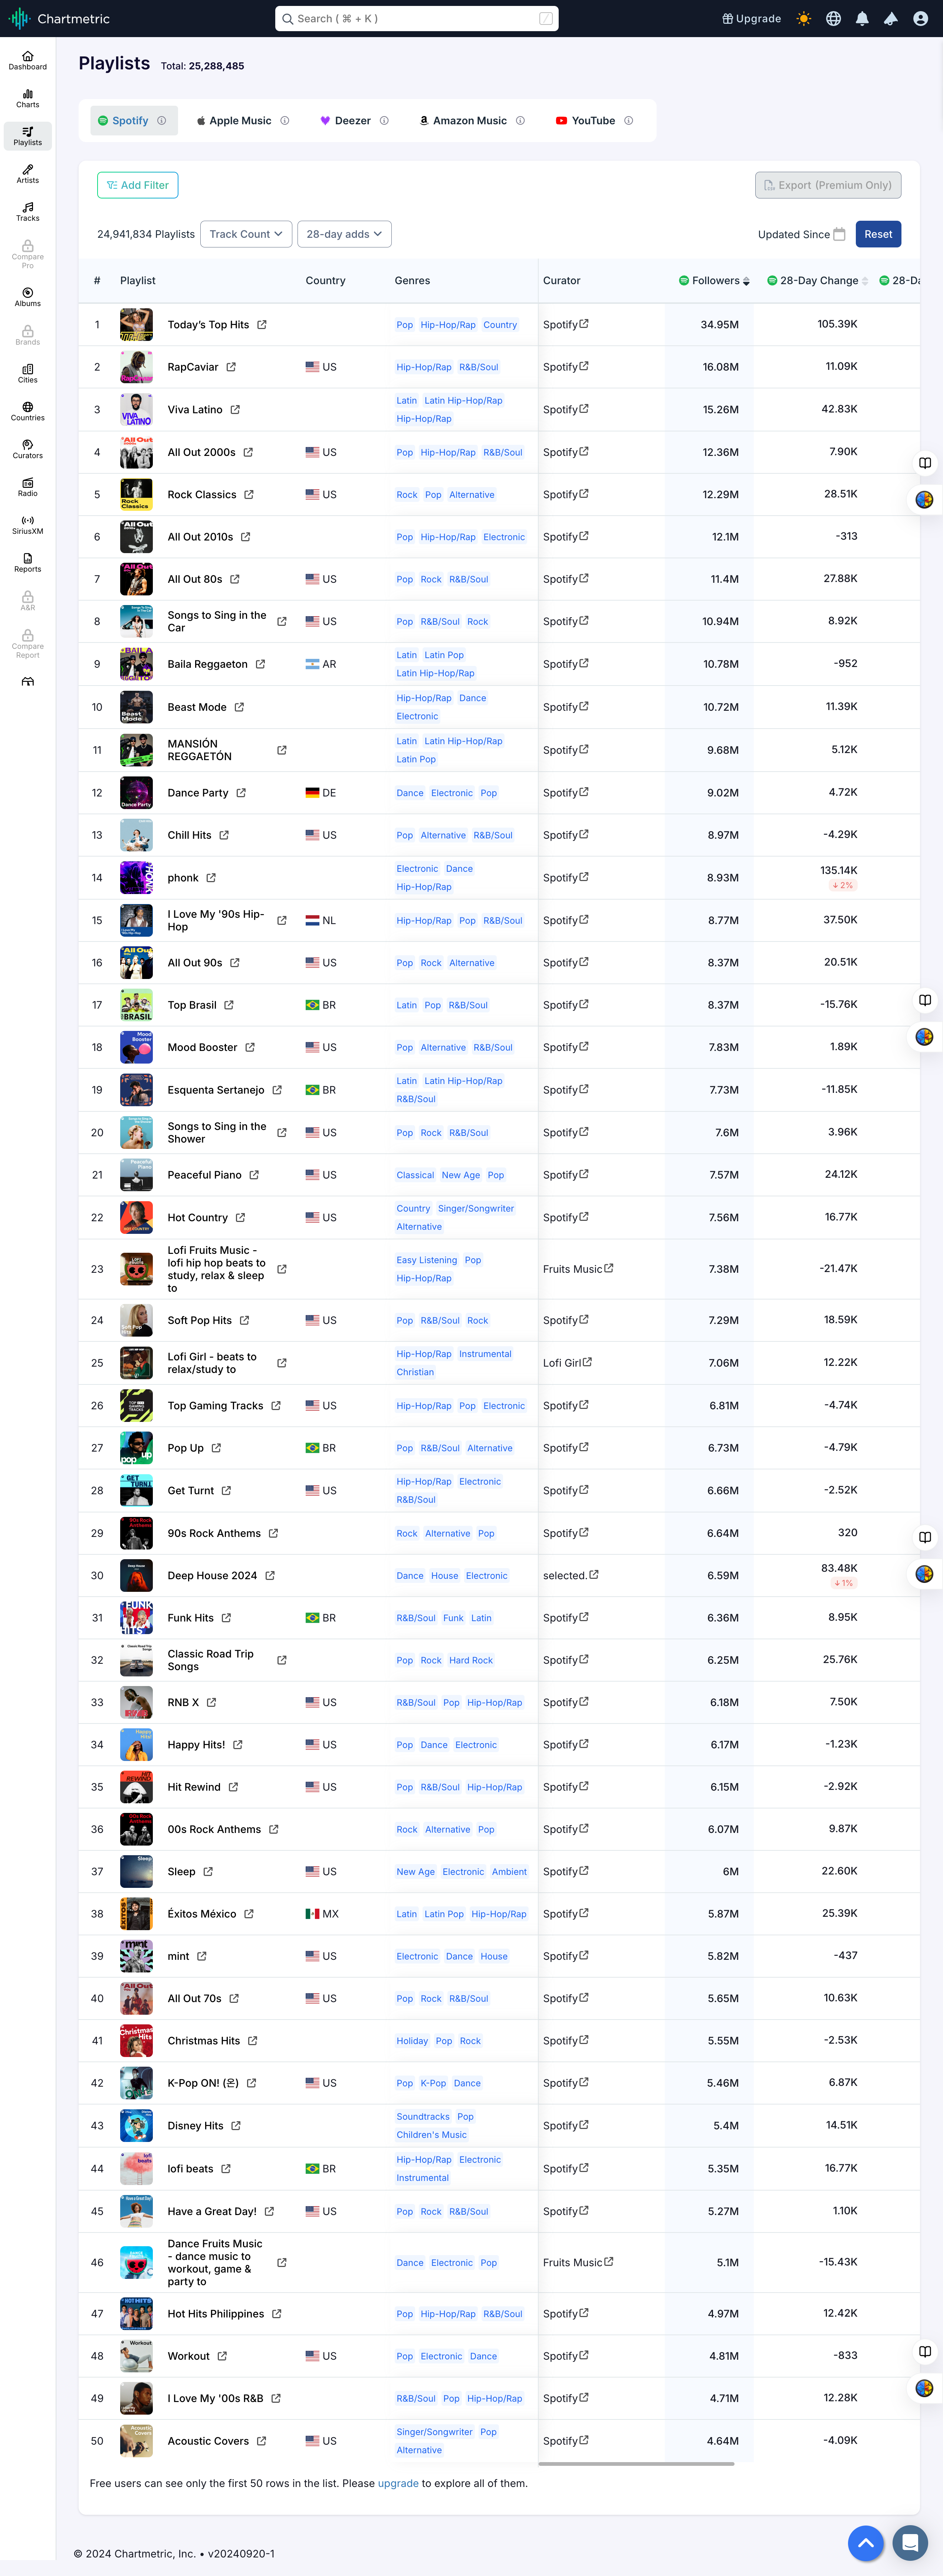
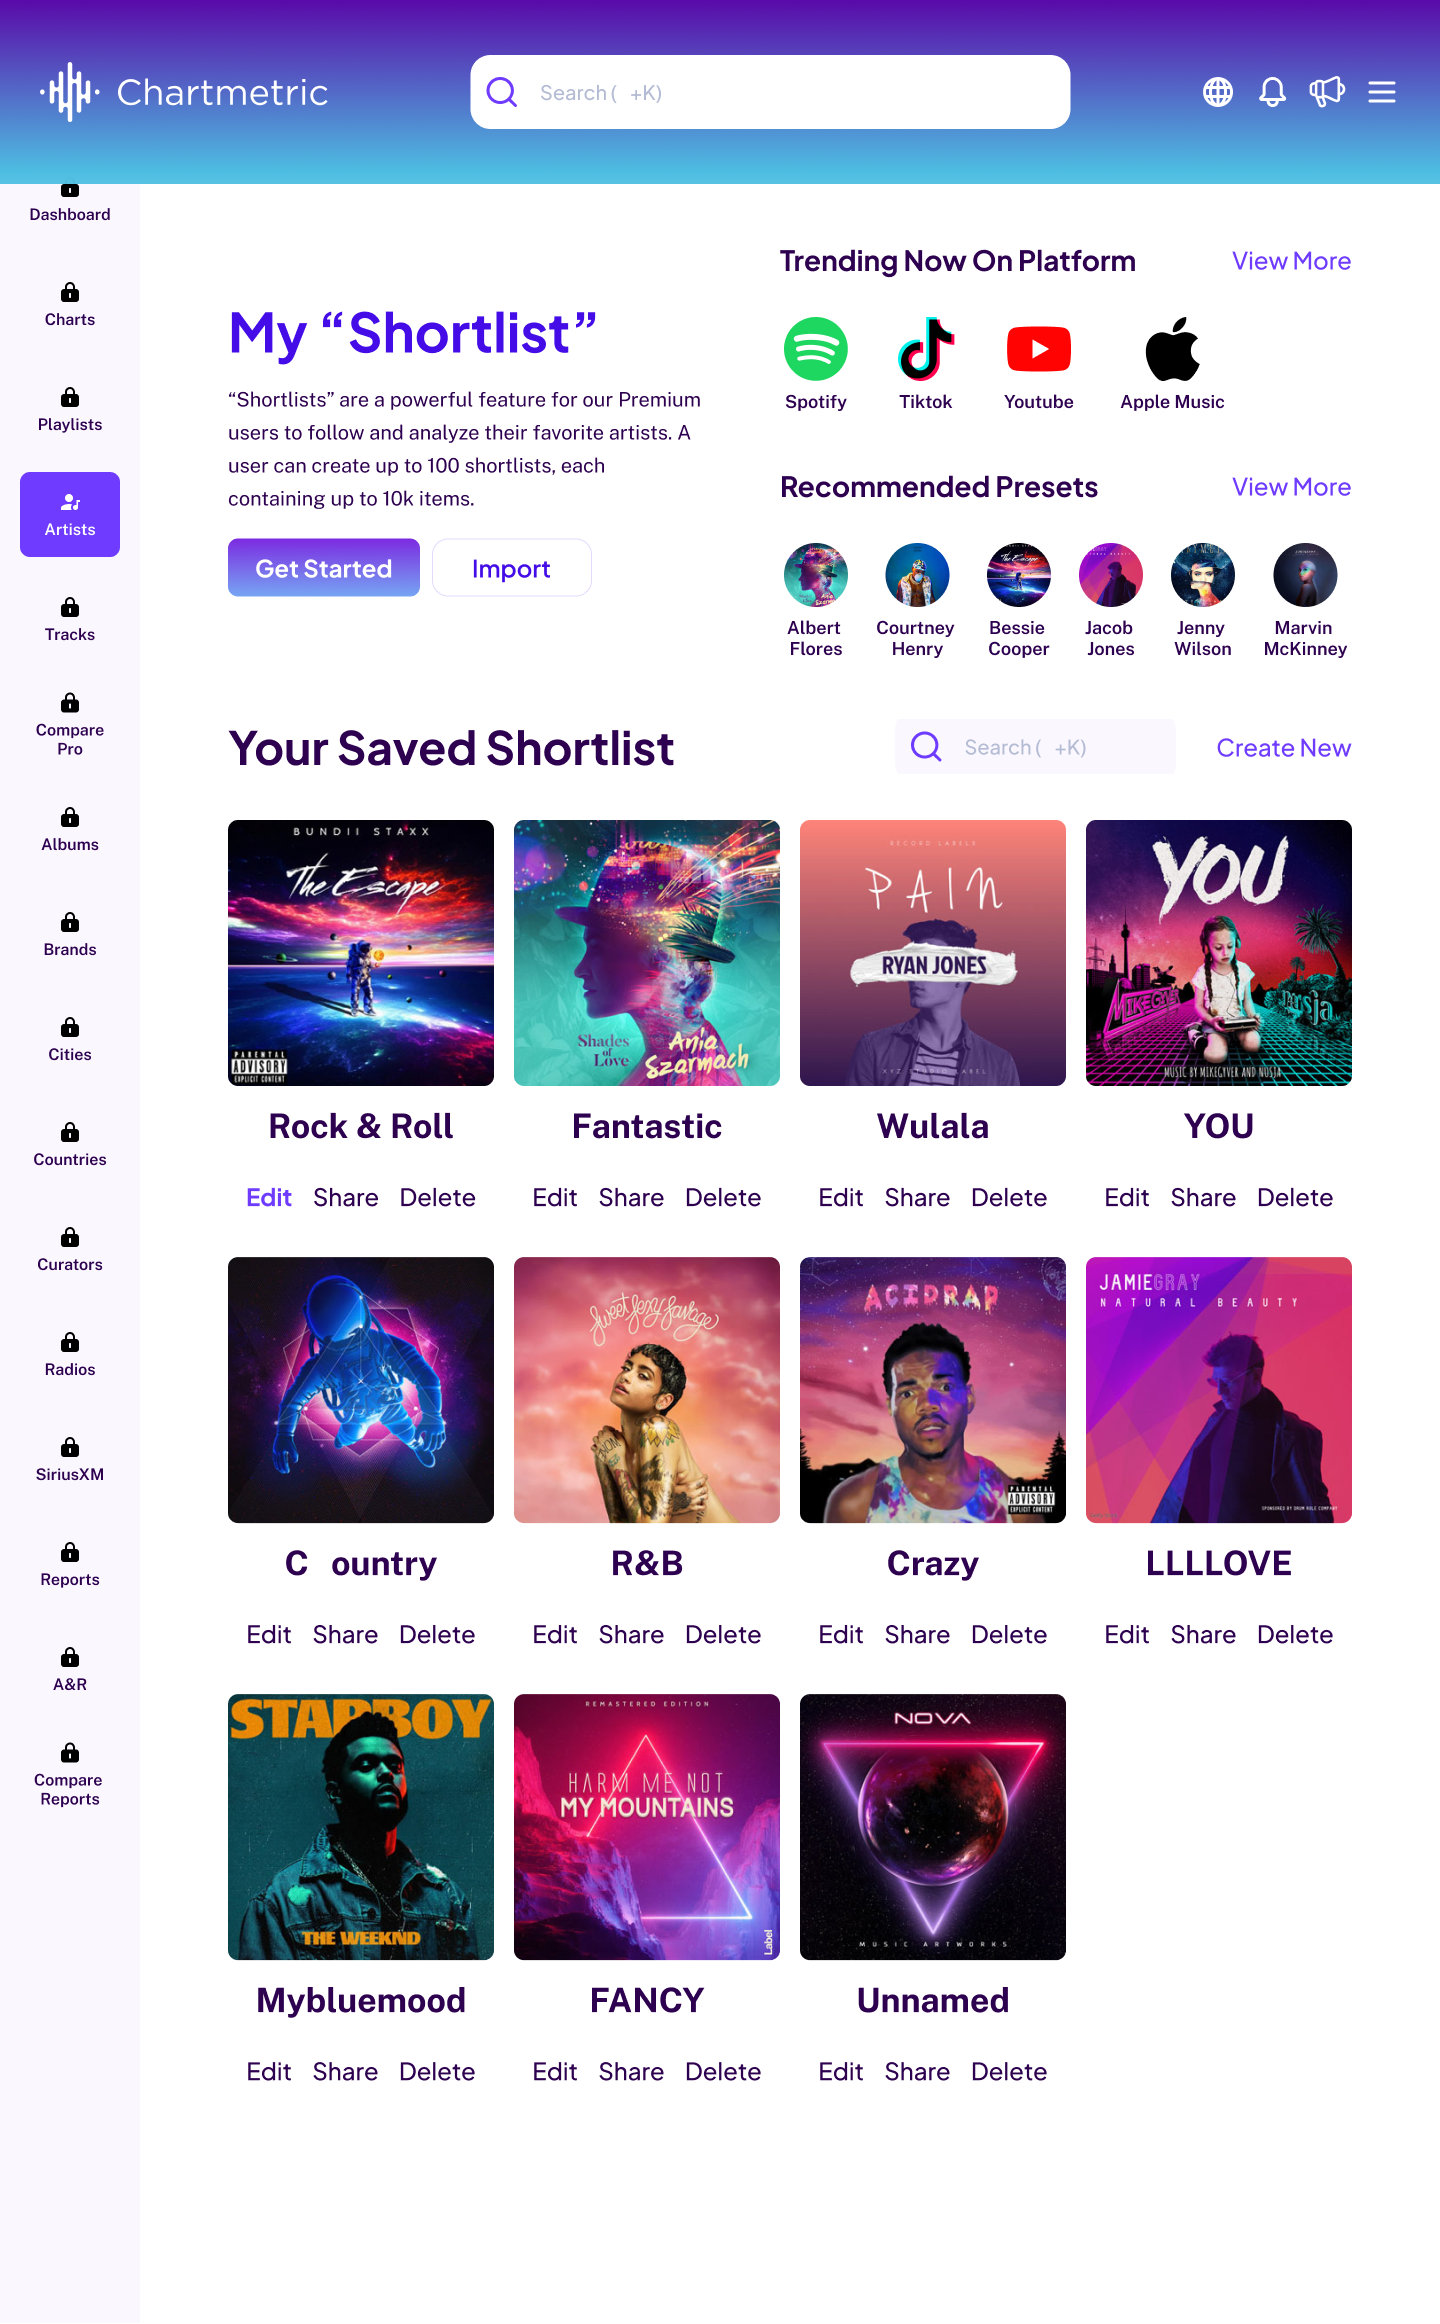
As a music label manager, I struggled to navigate the cluttered interface of Chartmetric. The overwhelming amount of playlist data in a dense, table-like format made it hard for me to quickly identify key insights or focus on what mattered most. Without visual aids or clear navigation, I spent too much time sorting through information, which slowed down my decision-making process.

User Story
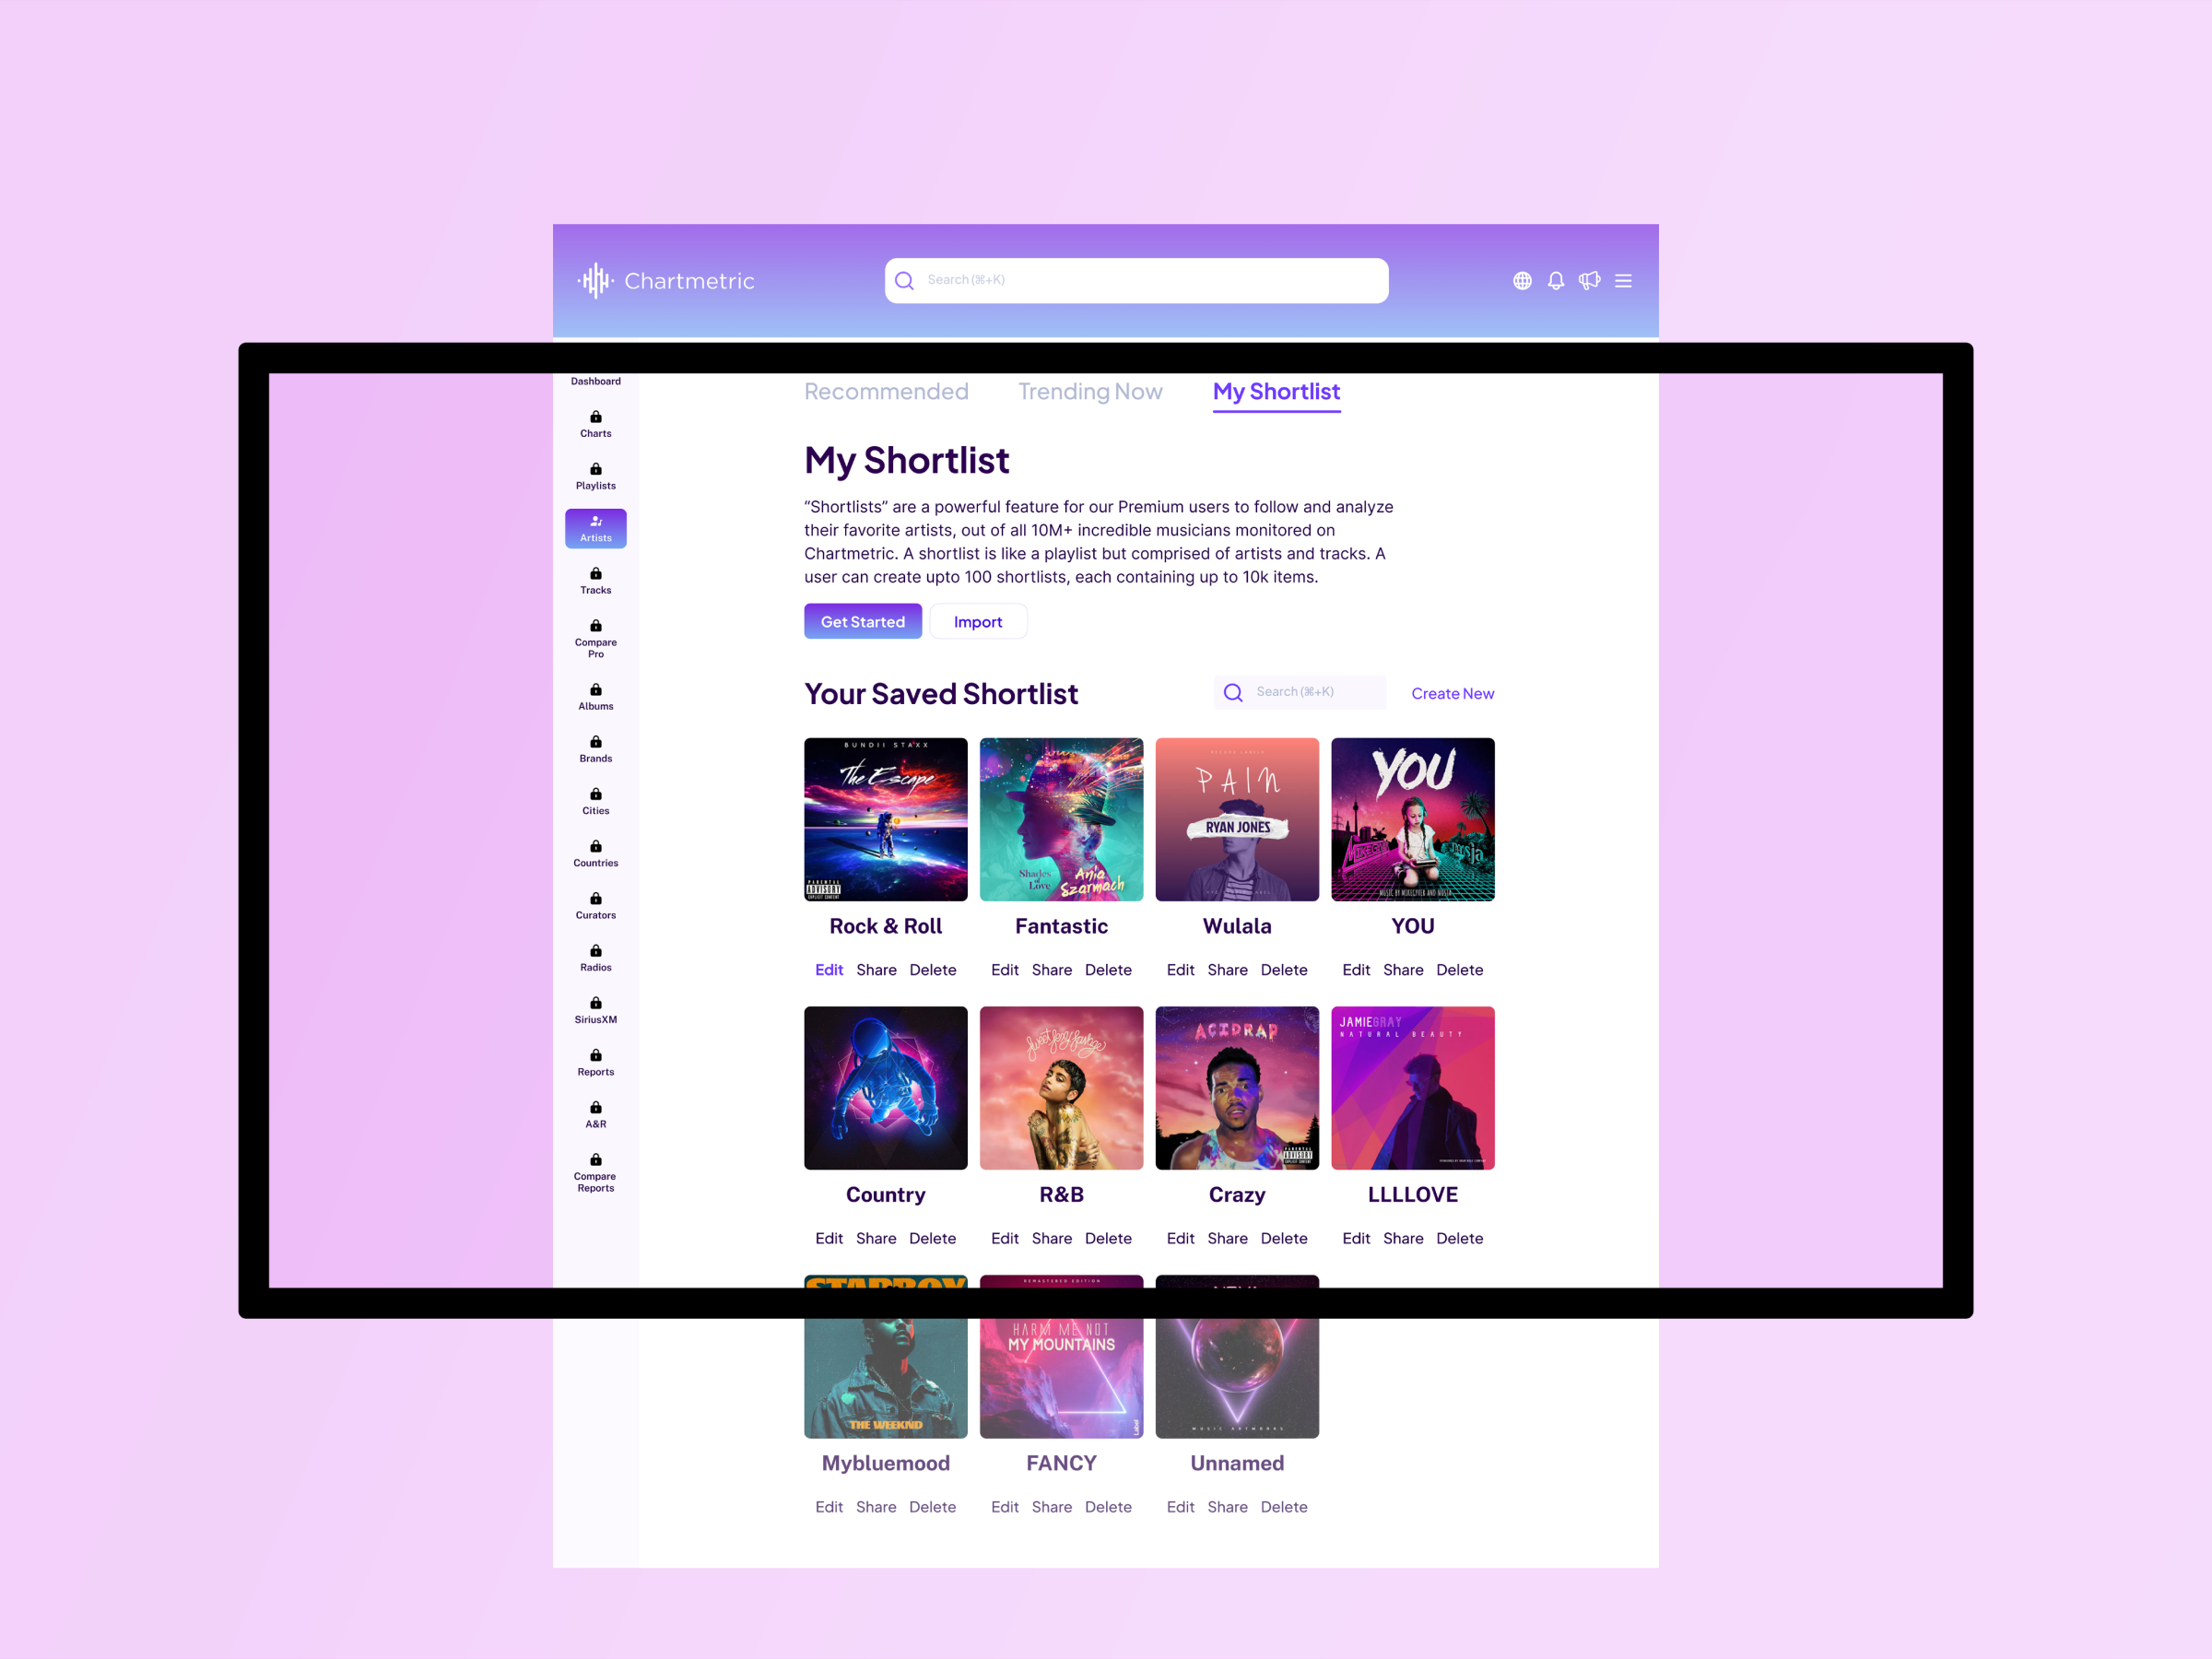
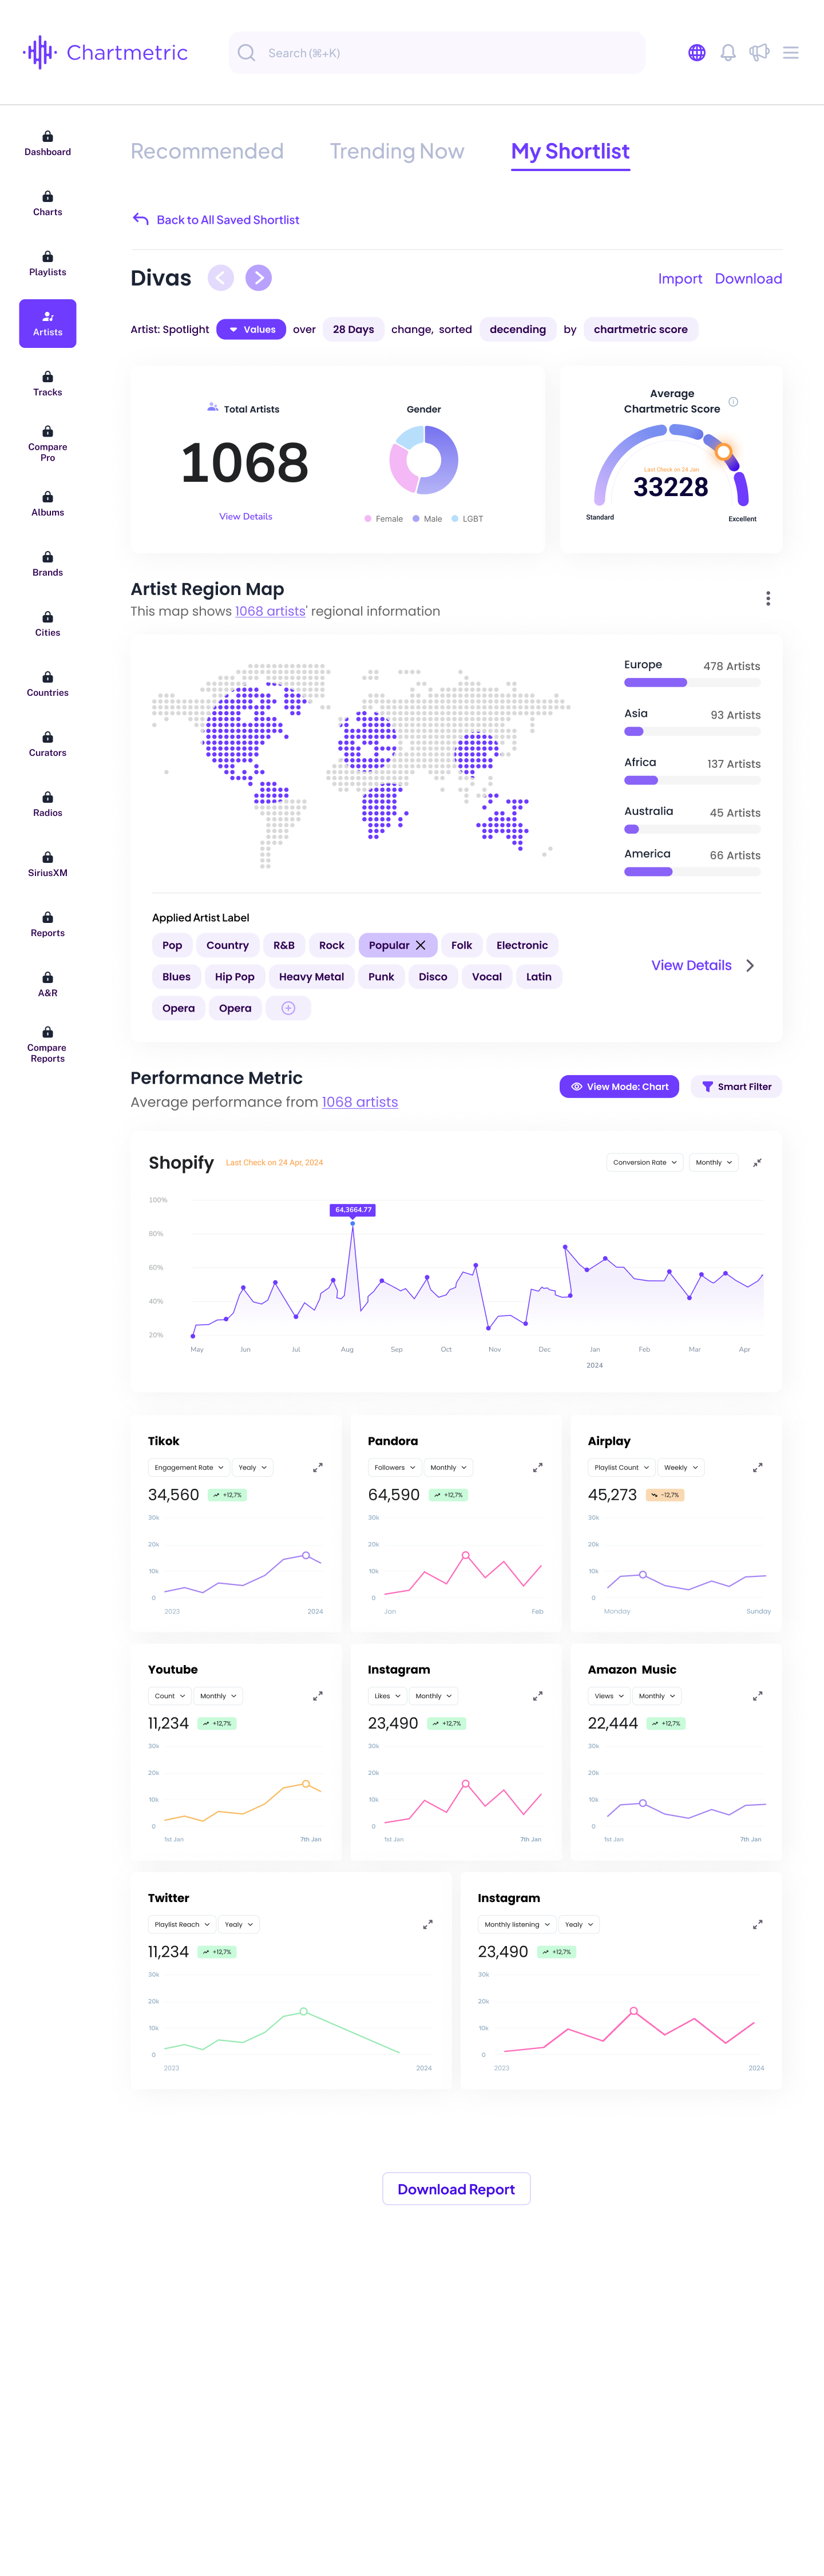
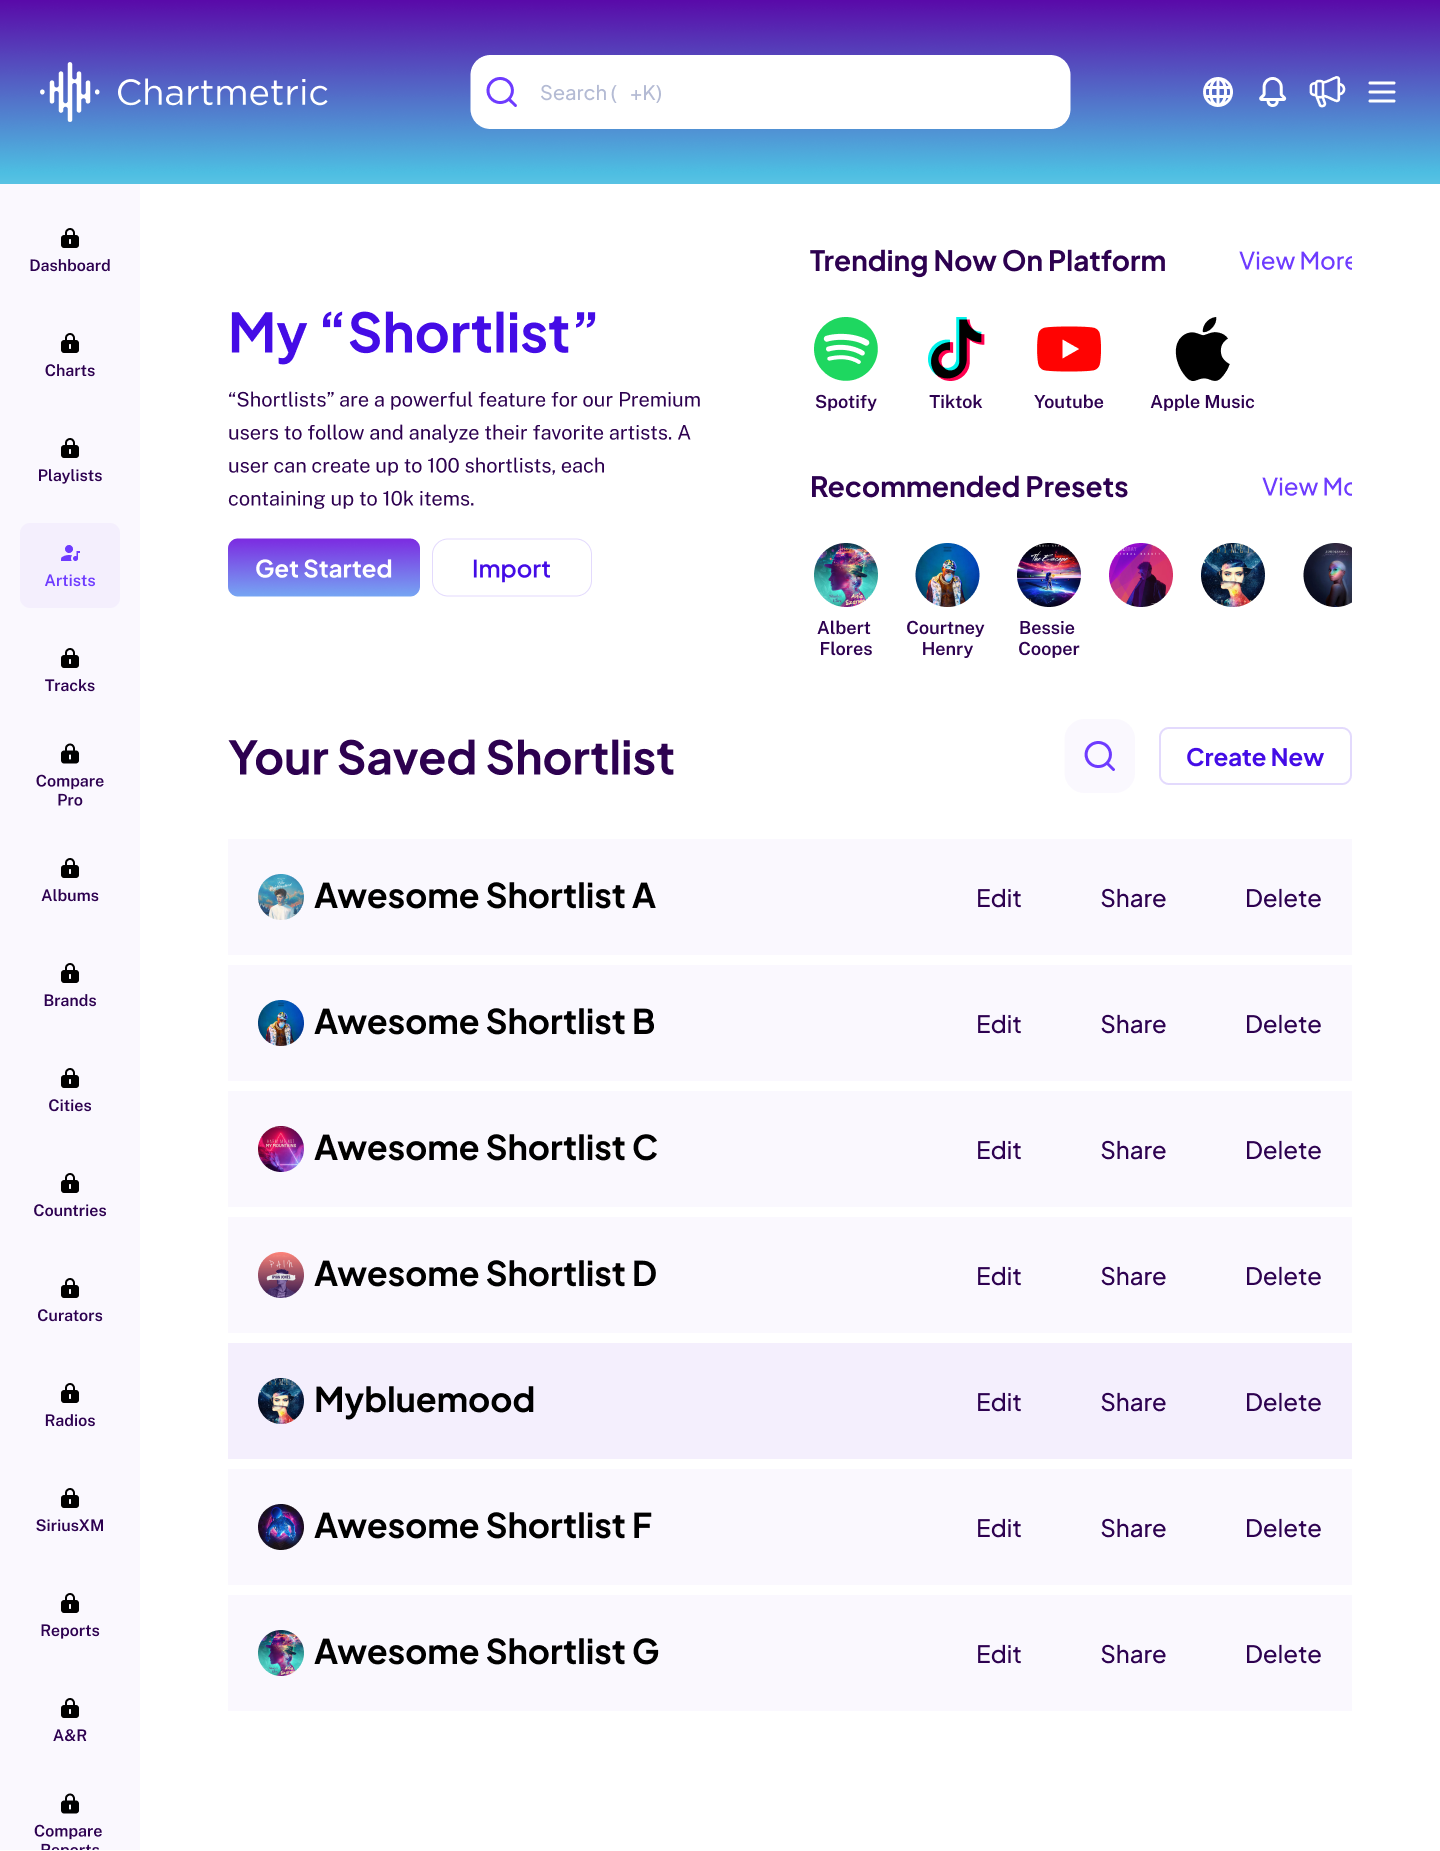
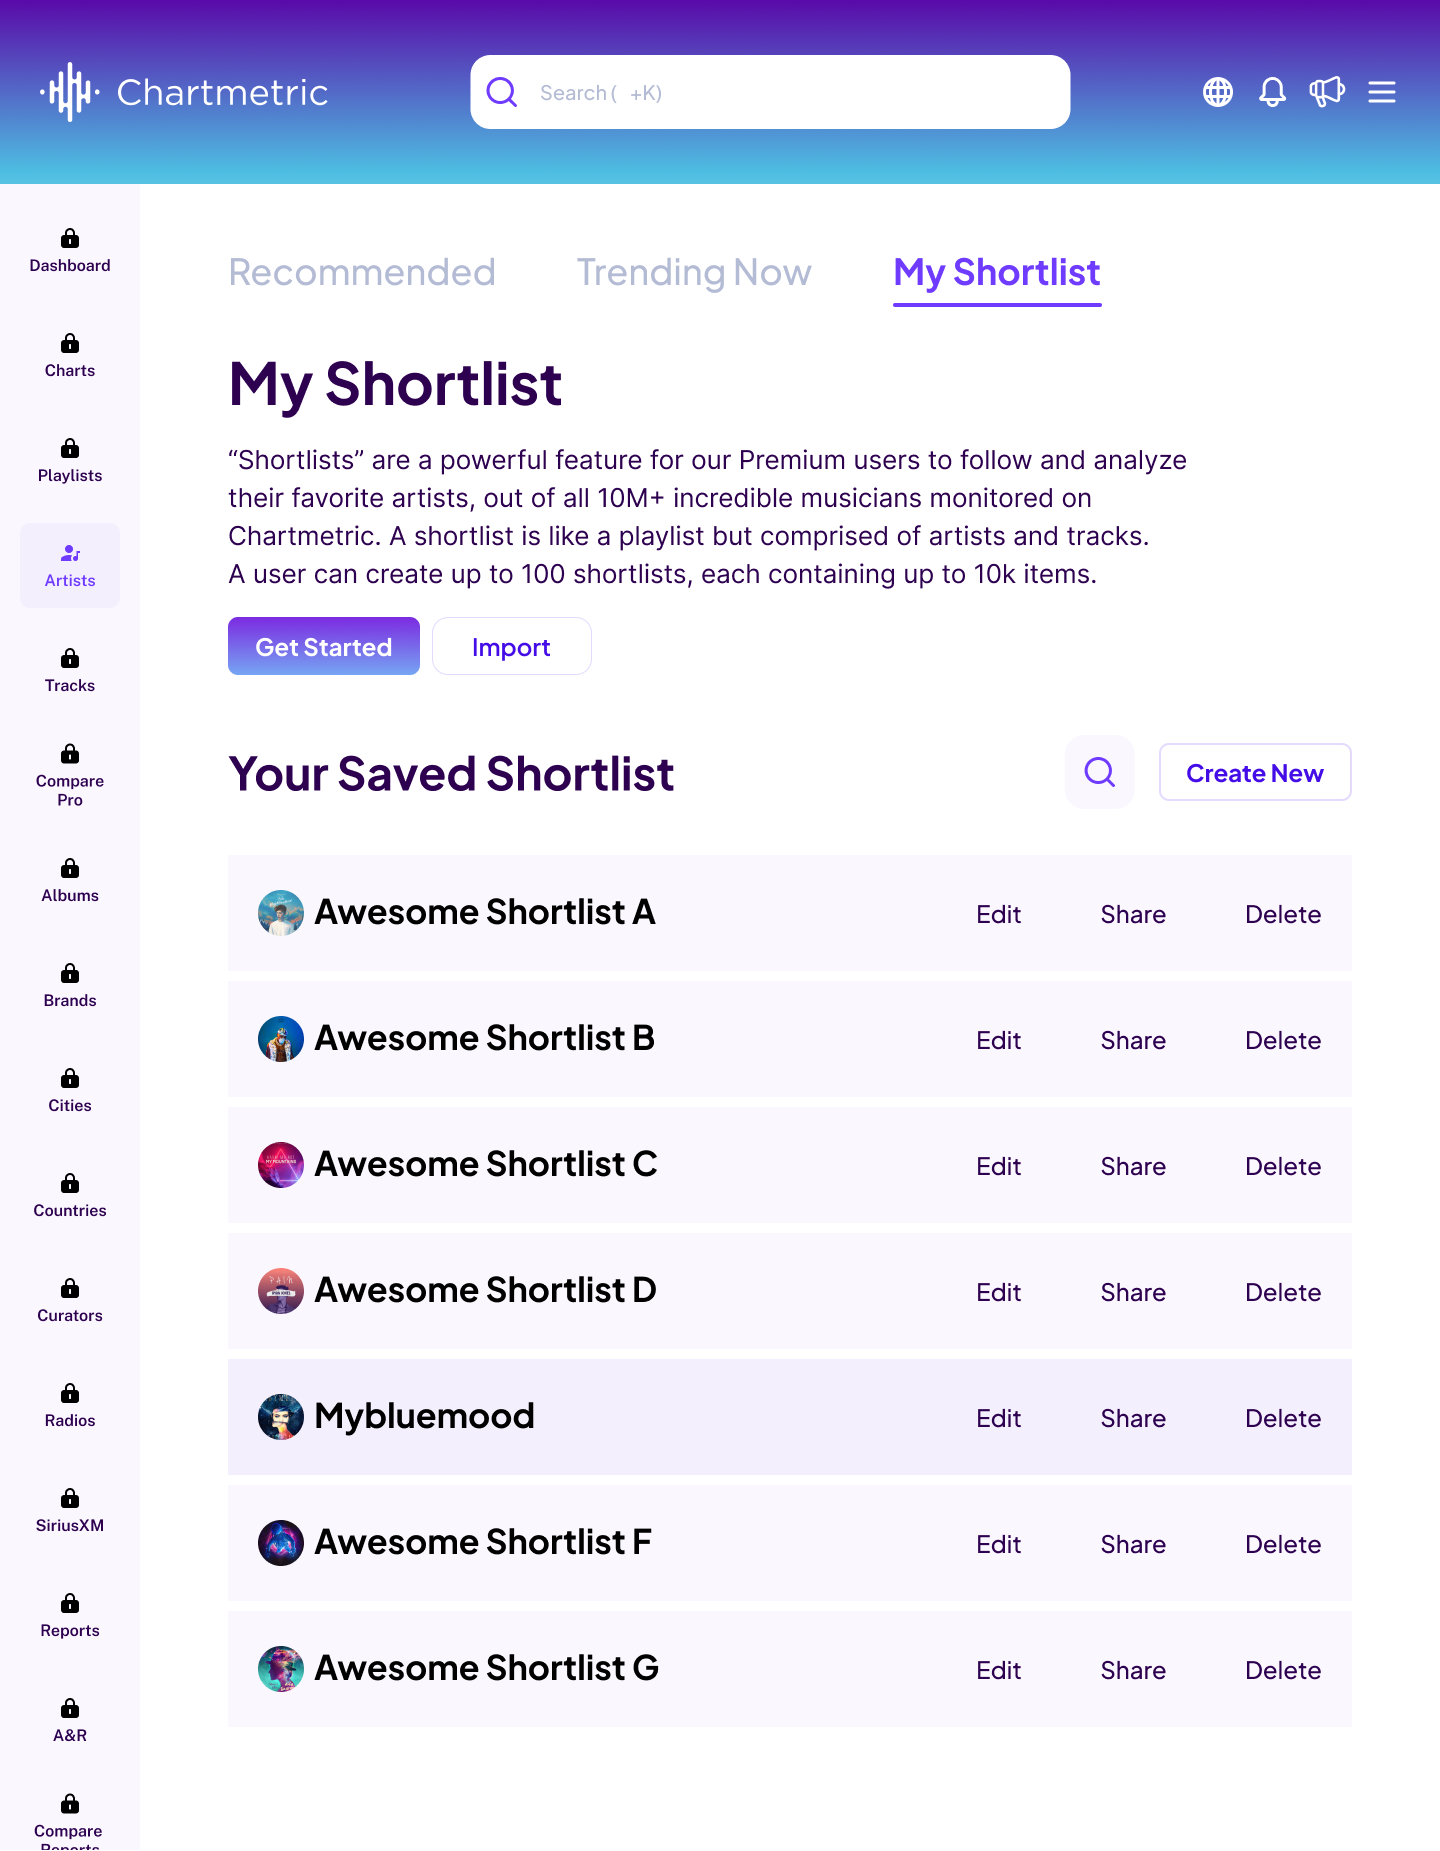
After the interface redesign, my experience improved drastically. The clean, dashboard layout allowed me to easily navigate through key artist and platform metrics. With the help of clear charts, graphs, and maps, I could quickly understand performance trends, saving me time and helping me make informed marketing decisions. The engaging, streamlined design made using Chartmetric much more efficient.
(In first month of launch, we successful get 220 user registered)
(Await the updates)
(Await the updates)
(Await the updates)
More Variants

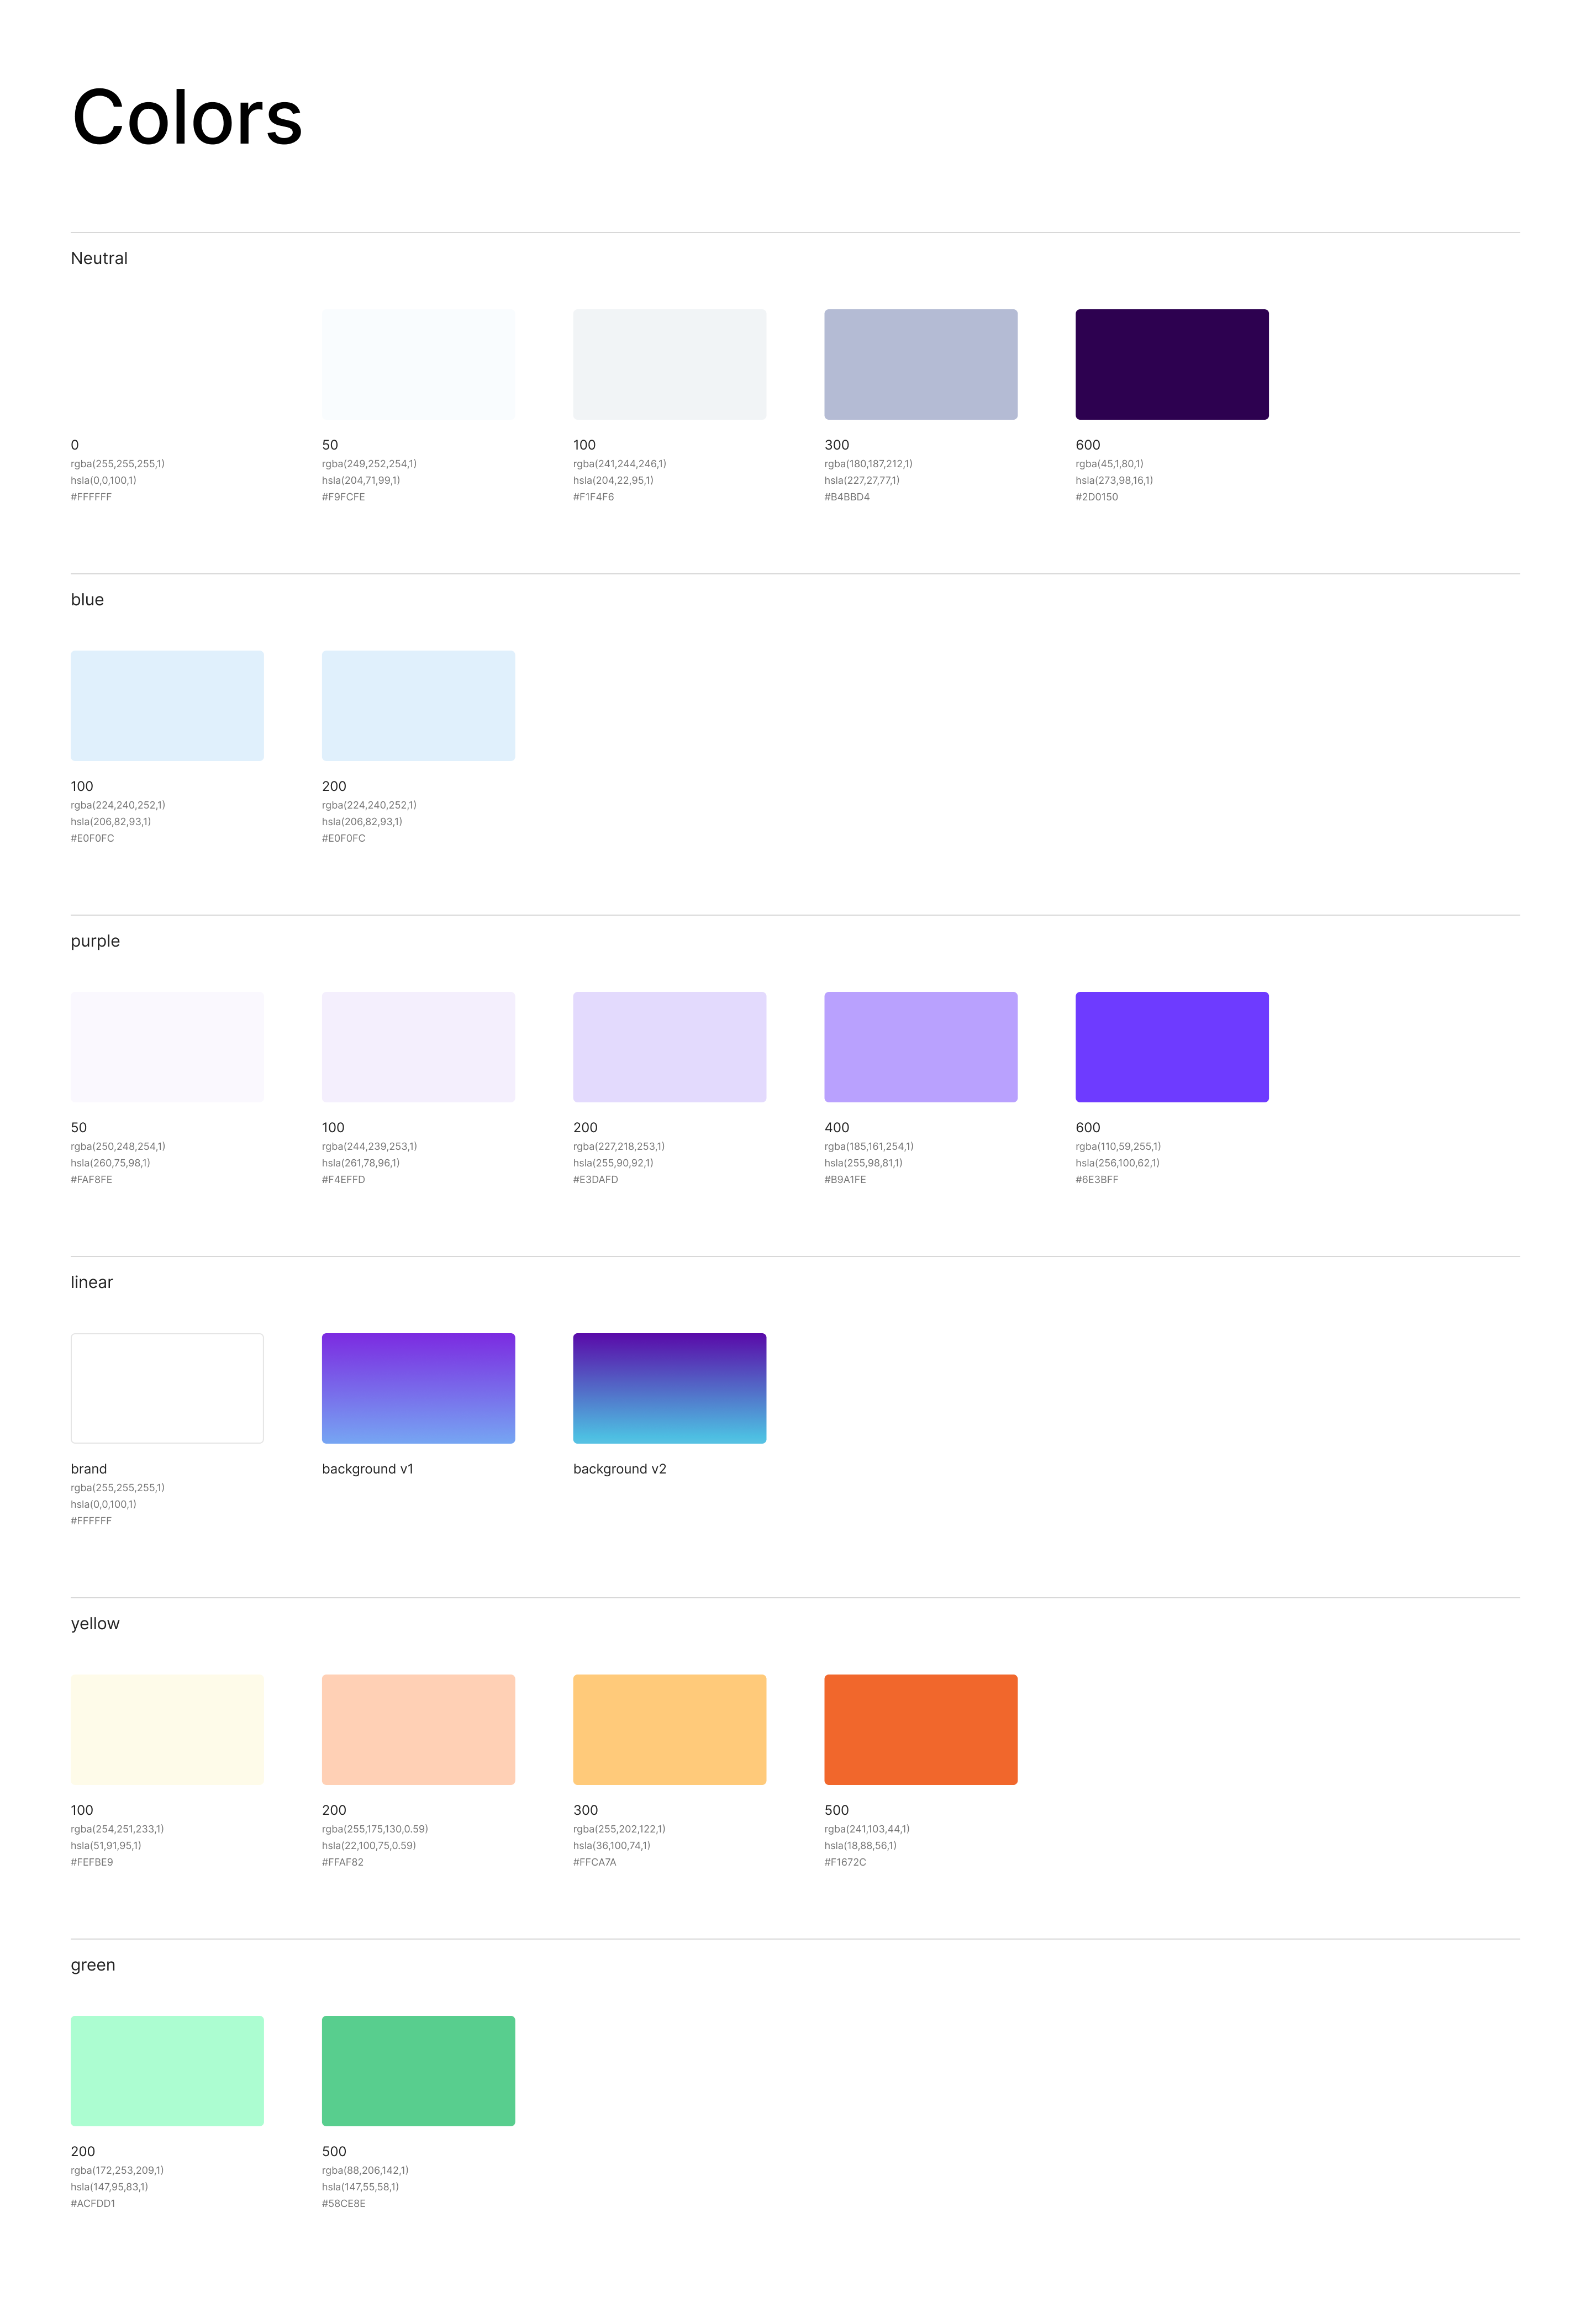
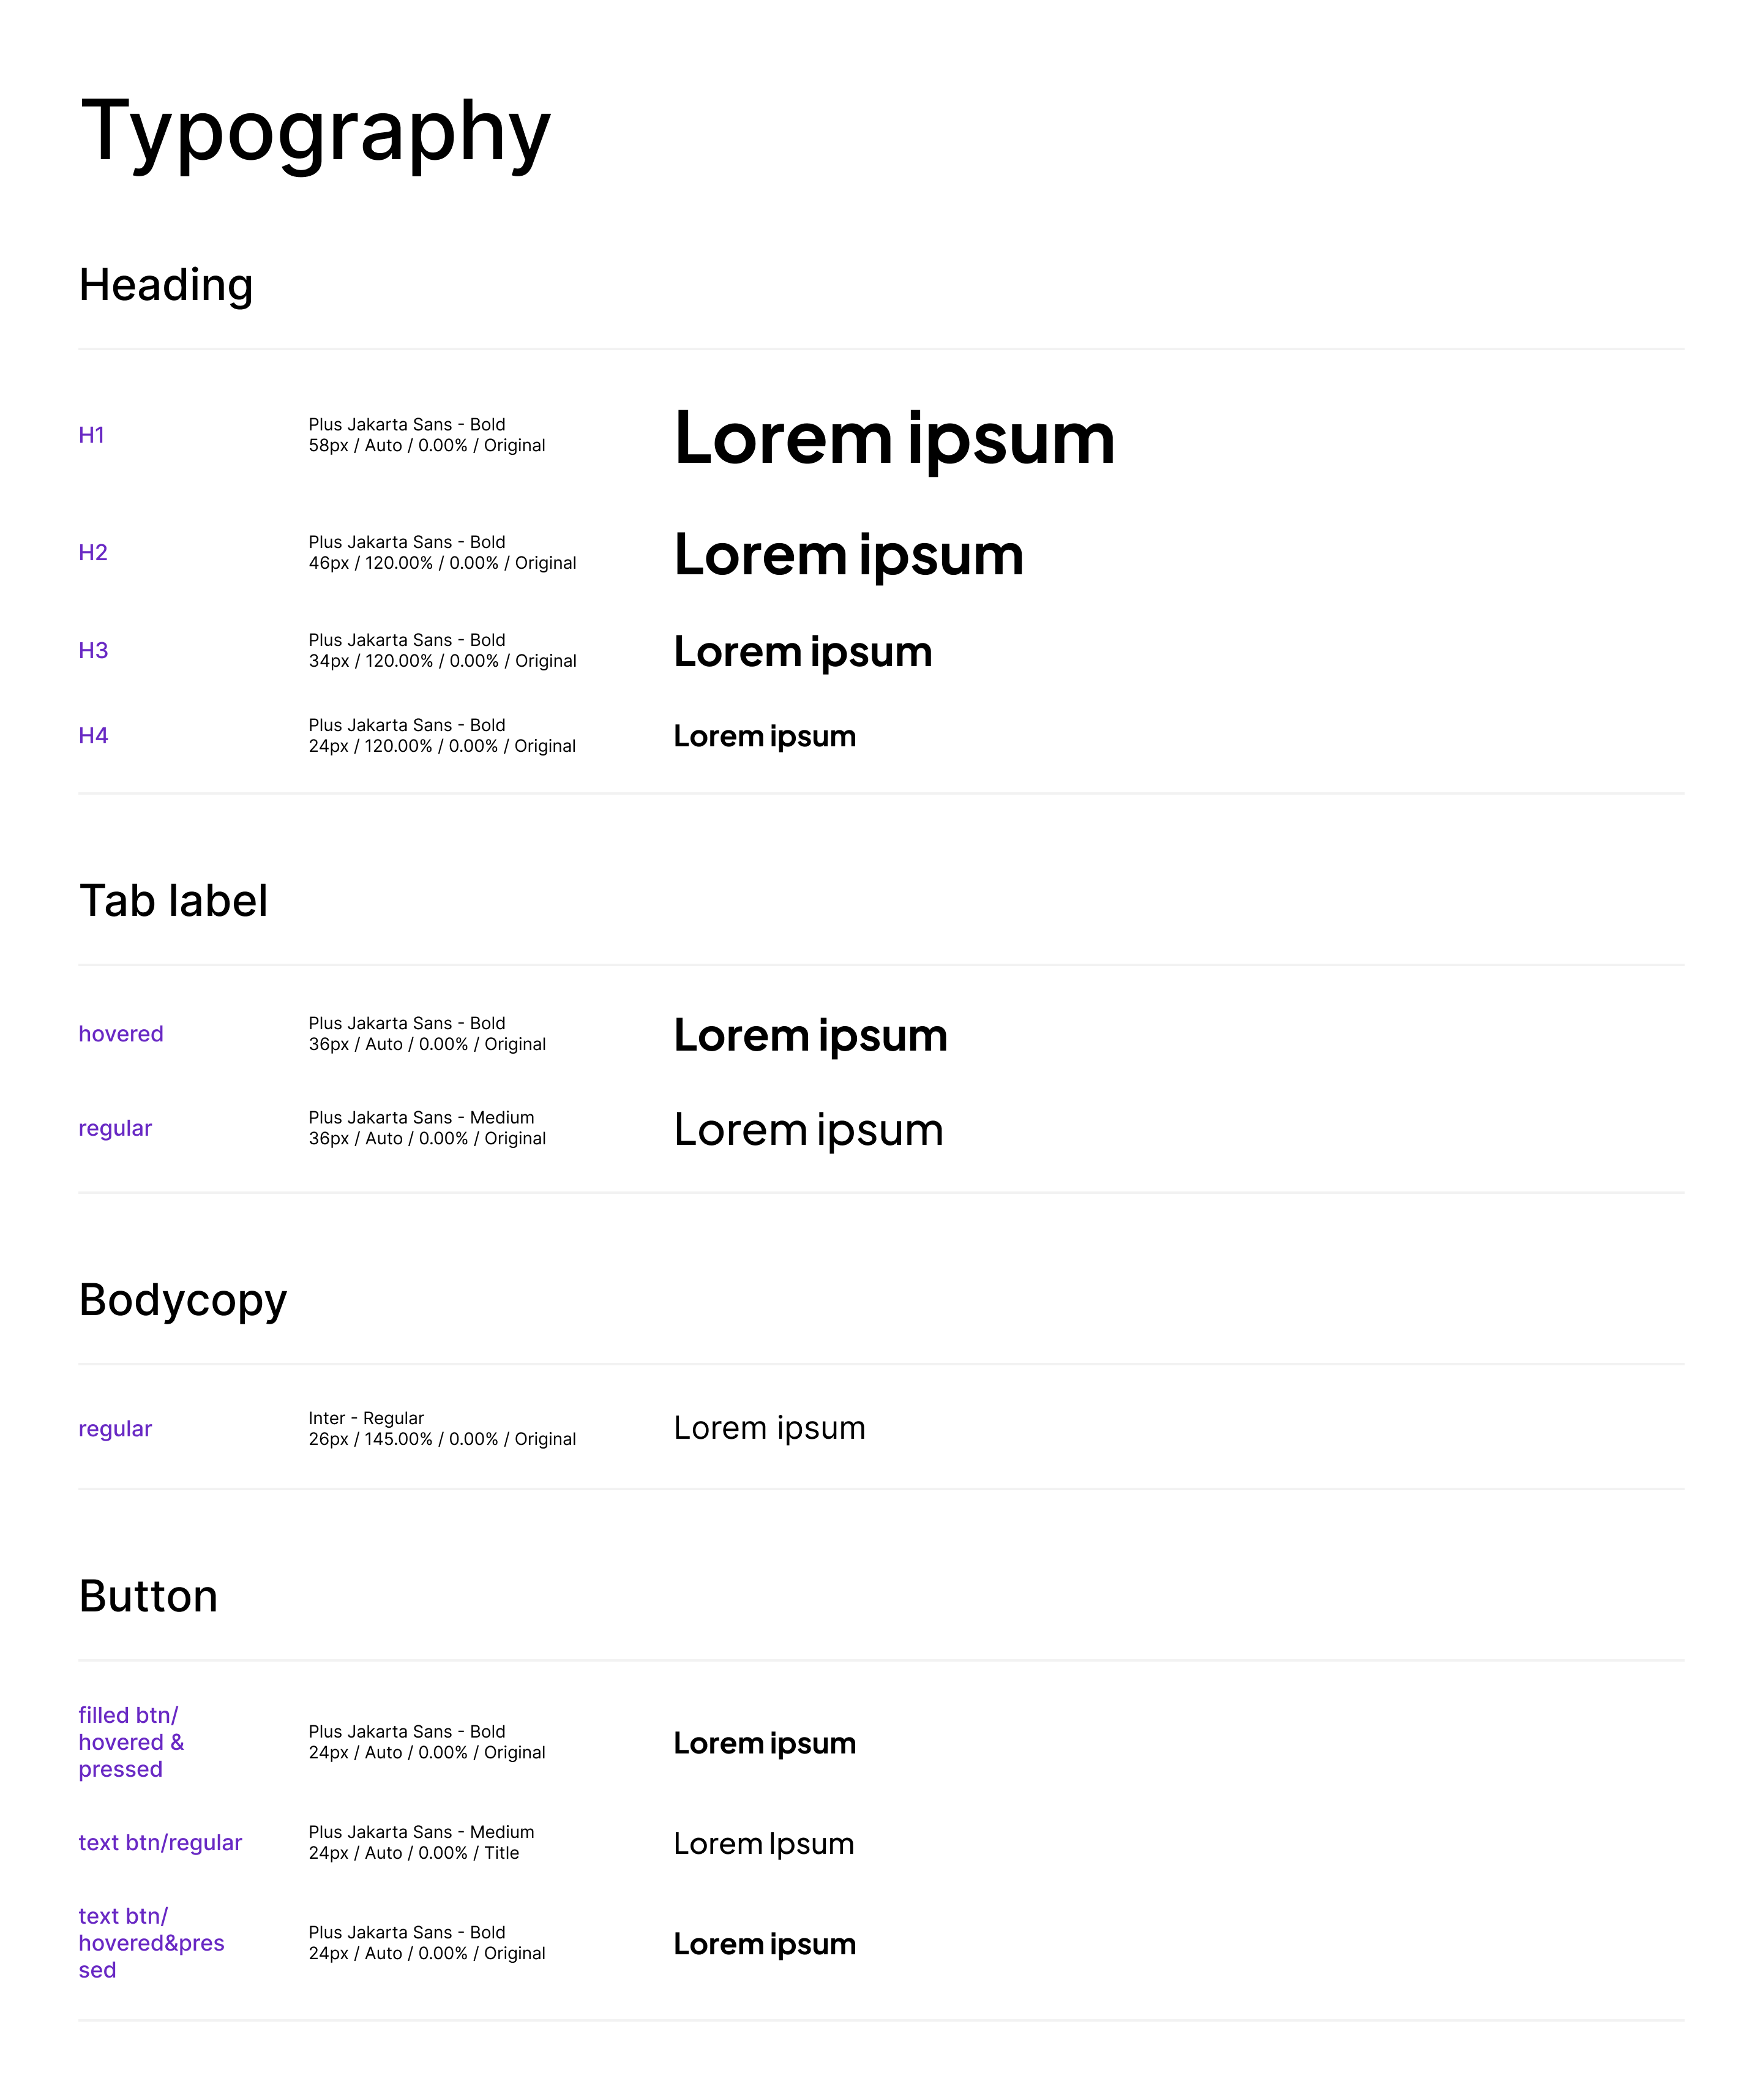
Design system
A design system is a comprehensive collection of standards, guidelines, and reusable components that ensure consistency and efficiency in the design and development of products. It includes elements like typography, color palettes, UI components, and interaction patterns, all aimed at creating a cohesive user experience across various platforms and devices.
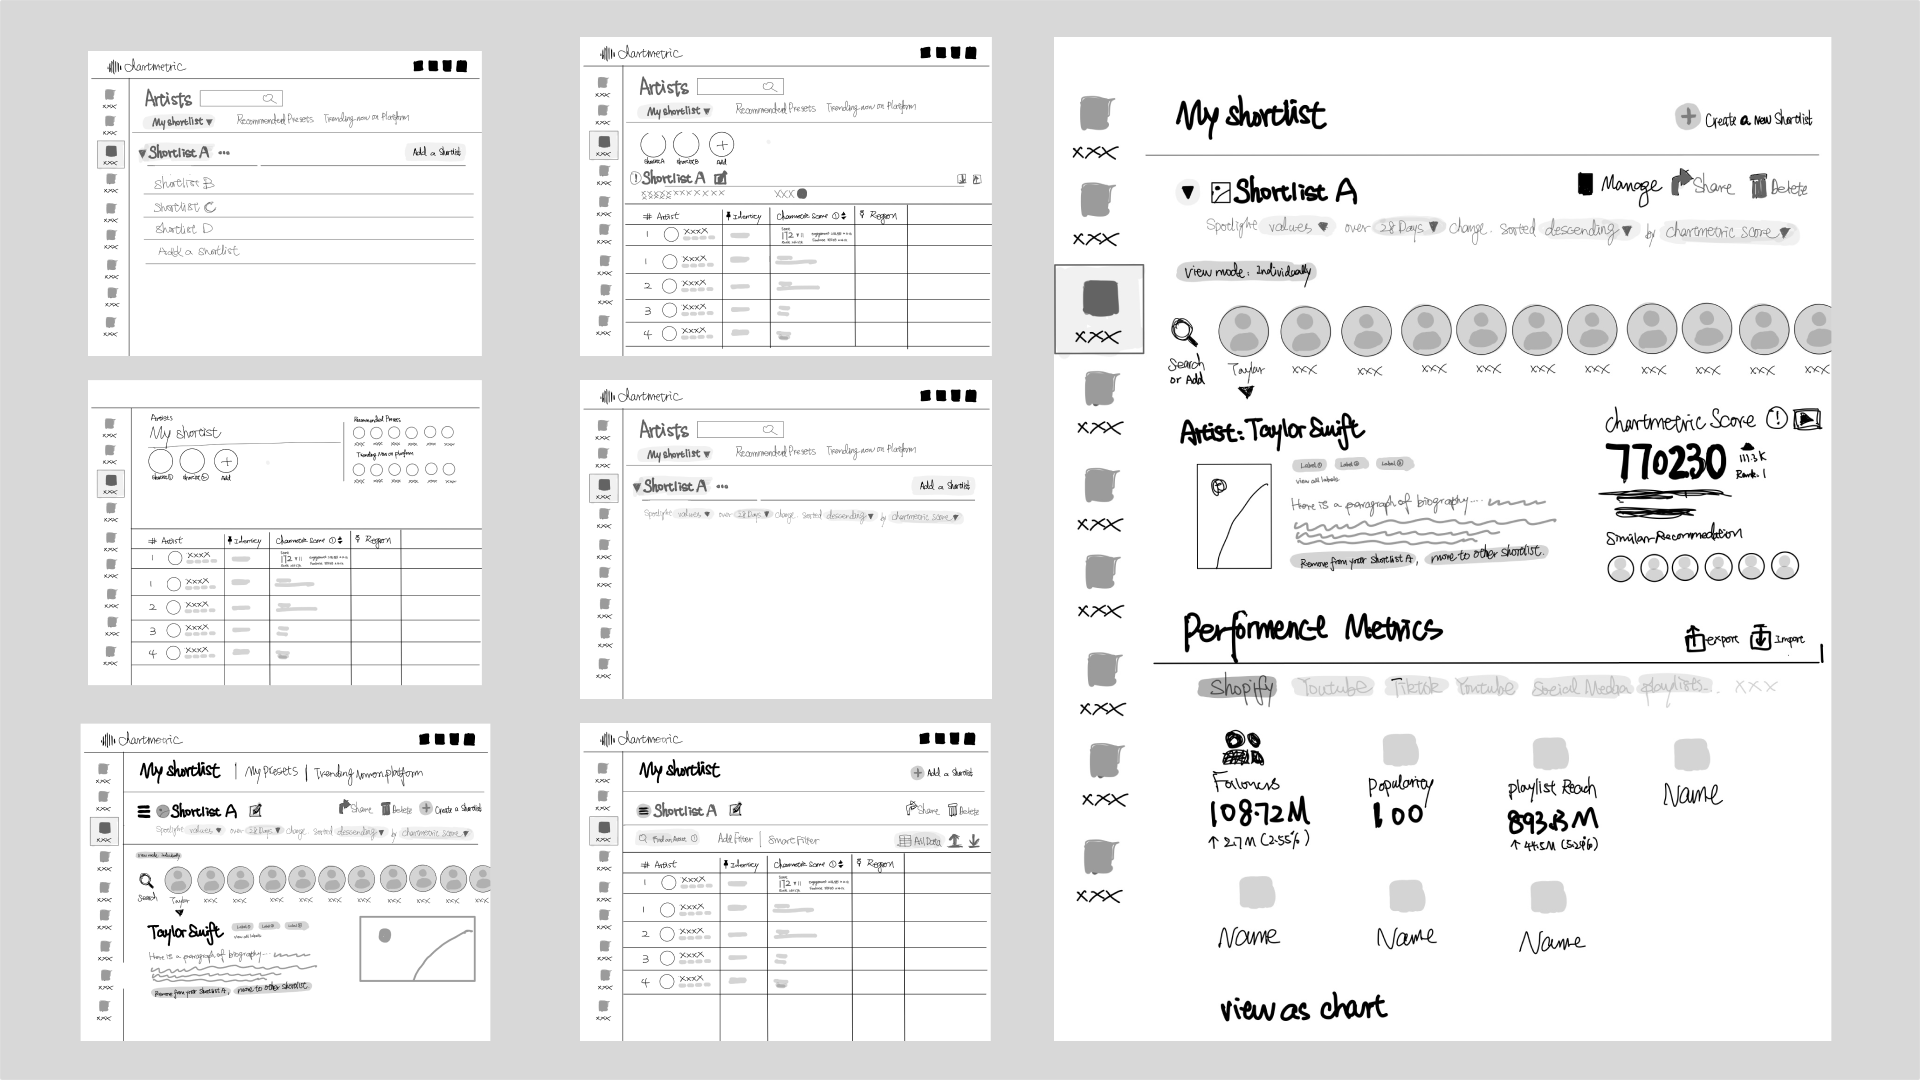
Sketching
Sketches are also important in the UX design process because they provide a quick and flexible way to brainstorm and explore different ideas. They allow designers to iterate rapidly, test various concepts, and receive early feedback without investing significant time and resources. Sketching helps in visualizing the overall structure and flow of the design, making it easier to identify and address potential issues early on. This foundational step ensures that the final design is well-thought-out, user-centered, and aligned with project goals.